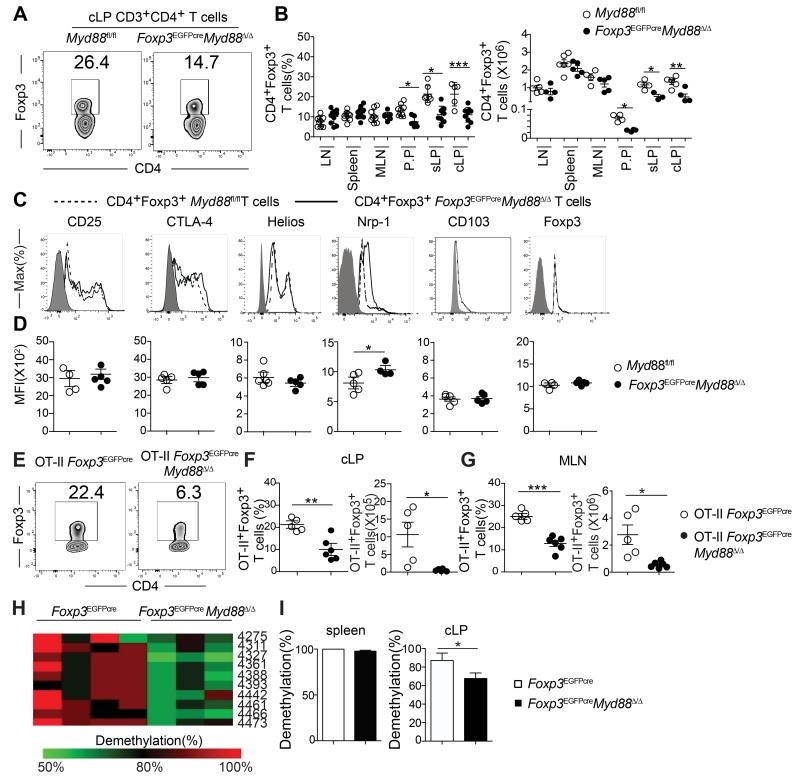
Figure 1. Treg cell-specific MyD88 deletion results in gut mucosa Treg cell deficiency.
A. Flow cytometric analysis of CD4+Foxp3+ Treg cells in the cLP of Myd88fl/fl and Foxp3EGFPcreMyd88Δ/Δ mice. B. Frequencies and absolute numbers of Treg cells in different tissues of Myd88fl/fl and Foxp3EGFPcreMyd88Δ/Δ mice. C, D. Flow cytometric analysis (C) and mean fluorescence intensity (MFI) (D) of CD25, CTLA-4, Helios, Nrp1, CD103 and Foxp3 cLP Treg cells of Myd88fl/fl and Foxp3EGFPcreMyd88Δ/Δ mice. E. Flow cytometric analysis of Foxp3 expression in cLP CD45.2+CD4+ T cells in CD45.1+ WT mice that received naïve CD45.2+CD4+Foxp3− T cells from OT-II+ Foxp3EGFPcre or OT-II+ Foxp3EGFPcreMyd88Δ/Δ mice and were then fed OVA in the drinking water for 1 week. F. Frequencies (left panel) and absolute numbers (right panel) of donor CD45.2+CD4+EGFP+ iTreg in the cLP of recipient mice from panel (E). G. Absolute numbers of donor CD45.2+CD4+Foxp3EGFP+ iTreg in the MLN of recipient mice. H. Methylation status of individual CpG motifs within the Foxp3 CNS2 in cLP Treg cells of Foxp3EGFPcre and Foxp3EGFPcreMyd88Δ/Δ mice. Individual CpG motifs are numbered with reference to the transcription initiation site of Foxp3. I. Global methylation status of Foxp3 CNS2 in splenic and cLP Treg cells shown in H. Results are representative of 4 independent experiments. N=3-8 mice/group. *p<0.05; **p<0.01; ***p<0.001 by Student’s unpaired two tailed t test and One-way ANOVA.

