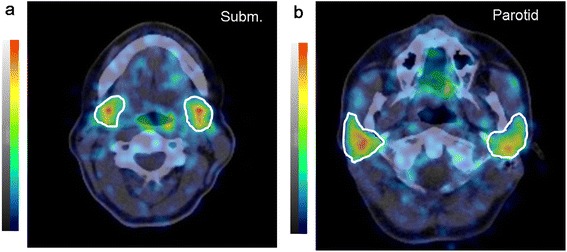
Figure 2.

Fused 124 I PET/CT slice views of the salivary glands 4 h after 124 I administration. Transverse slice images of the submandibular (a) and parotid (b) glands with volumes of interest (indicated by white lines) are shown. The grayscale (CT) and colour scale (PET) ranges were −125 to 225 HU and 0 to 2 kBq/mL, respectively.
