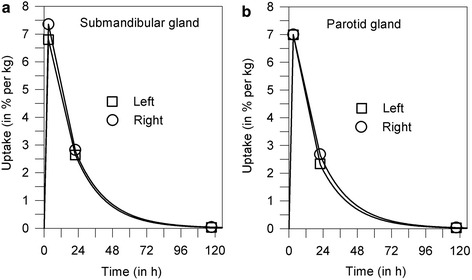
Figure 3.

Representative examples of the (projected) 131 I uptake curve of the salivary gland. The measured uptake values (symbols) of the submandibular (a) and parotid (b) glands are in percentage of administered activity per kilogram of gland tissue. Solid lines indicate the fitted curves.
