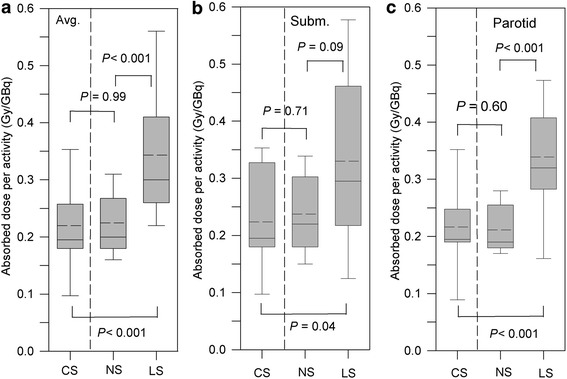
Figure 4.

Distribution of the absorbed dose per administered activity for the different stimulation types. The absorbed dose distributions averaged over both gland types (a) and separately for the submandibular (b) and parotid glands (c) are shown. In the absorbed dose calculation, the 3-point model was used. The levels of significance between the groups are characterized by P values. The chewing-gum stimulation, non-stimulation, and lemon-juice stimulation groups are designated by CS, NS, and LS, respectively.
