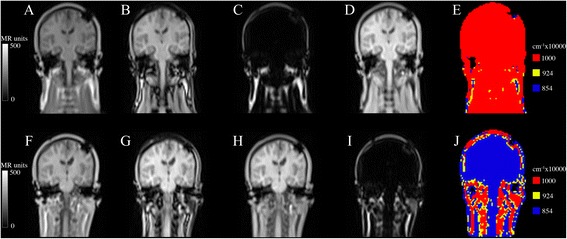
Figure 1.

Dixon images in a patient with both inverted and non-inverted fat/water tissues. In the first scan (A-E) and inverted in second scan (F-J). (A) and (F) in-phase, (B) and (G) opposed-phase, (C) and (H) fat, (D) and (I) water, and (E) and (J) MR-ACDixon shown in rainbow colors for visualization purposes.
