Figure 3.
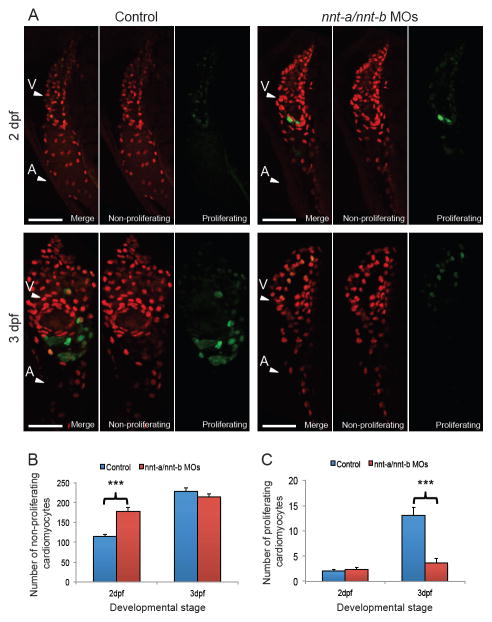
Suppression of nnt-a/nnt-b in zebrafish results in altered cardiomyocyte proliferation. A. Representative maximum intensity projections of cardiac sections from control and nnt-a/nnt-b morphants (5 ng each MO injected/embryo) at 2 dpf and 3 dpf were used to monitor non-proliferating (cmlc2:mCherry-zCdt1, red, G1 phase of the cell cycle) and proliferating (cmlc2:Venus-hGeminin, green, S/G2/M phase of the cell cycle) cardiomyocyte counts. Cardiomyocytes with only the green signal were counted as proliferating (exemplified by 2 dpf nnt-a/nnt-b or 3 dpf control panels). Scale bars, 50 μm; arrowheads point to the ventricle (V); or atrium (A). B. Quantification of non-proliferating cardiomyocytes as indicated by red+green− or red+green+ cells. C. Quantification of proliferating cardiomyocytes as indicated by red−green+ cells. p<0.0001; student’s t-test; n=12 larvae/injection batch, repeated once with similar results. Error bars represent standard error of the mean (sem).

