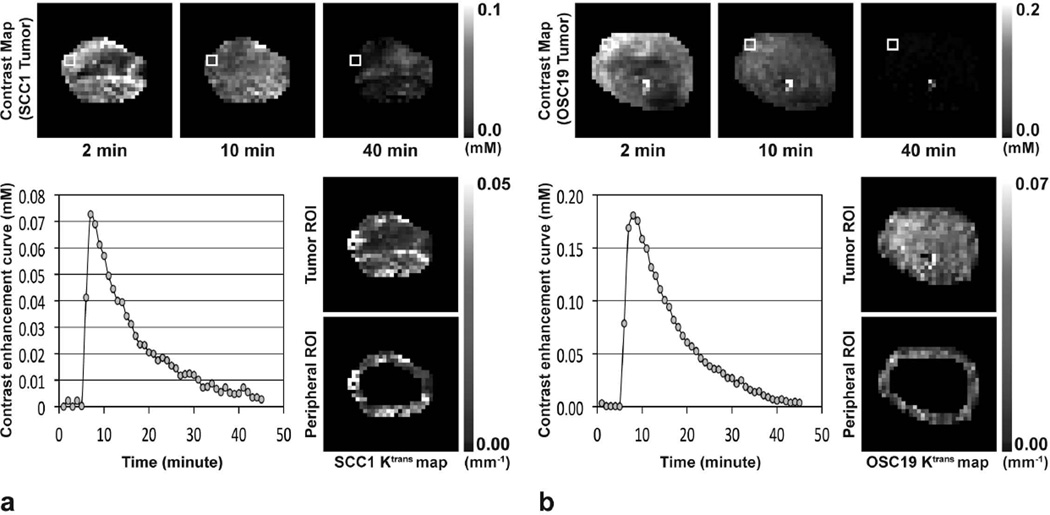
Figure 1.
MR contrast maps at 2, 10, and 40 minutes after gadoteridol injection, and Ktrans maps in entire tumor region or 0.5-mm thick peripheral tumor region of representative (a) SCC1 and (b) OSC19 tumors prior to therapy initiation. Contrast enhancement curves averaged in the four pixels indicated with solid white box in each contrast map are shown.

