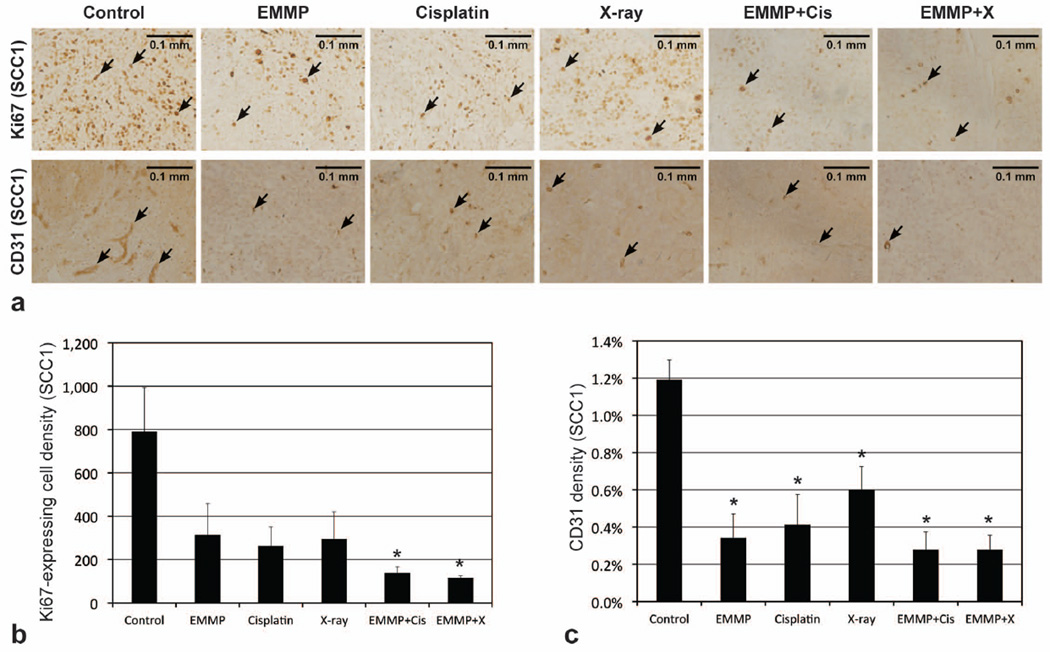
Figure 3.
Histological analyses of SCC1 tumors. (a) Representative microphotographs of Ki67 and CD31 stained tumor slices (5 µm thickness), when tumors were untreated (control) or treated with anti-EMMPRIN antibody (EMMP), cisplatin, X-ray irradiation, anti-EMMPRIN antibody plus cisplatin (EMMP+Cis), and anti-EMMPRIN antibody plus X-ray irradiation (EMMP+X), respectively. Ki67 expressing (proliferating) and CD31 stained (endothelial) cells are indicated with black arrows, and the length of each scale bar is 0.1 mm. (b) Ki67 expressing cell and (c) CD31 densities (mean±SE). Asterisk represents statistical difference from control group.

