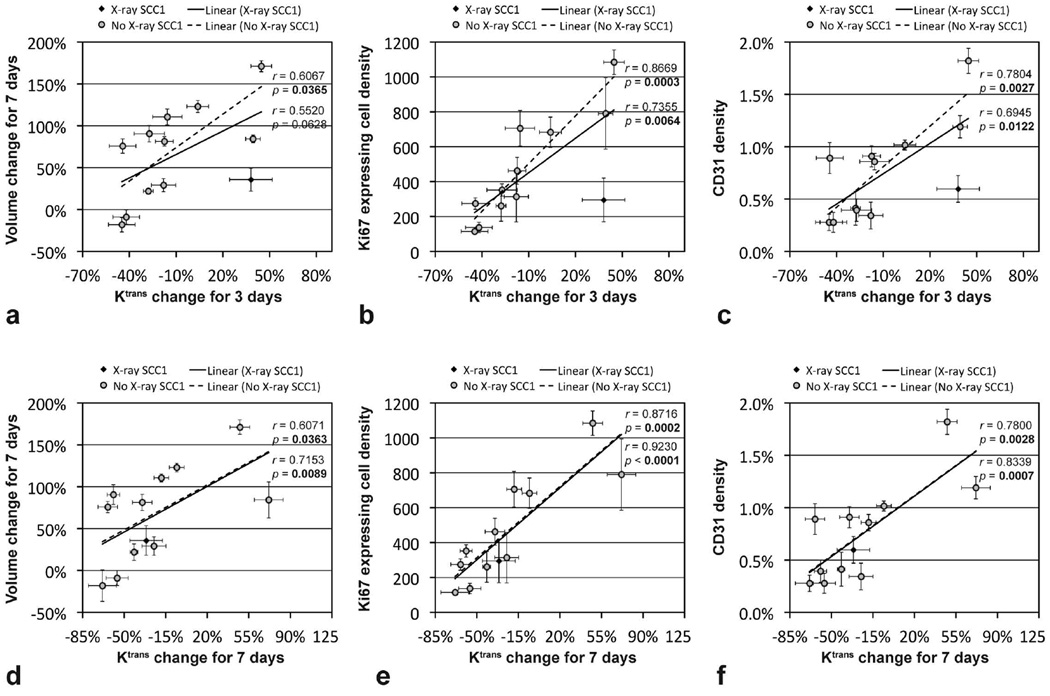
Figure 5.
Correlation between the mean tumor Ktrans change (either for 3 days or 7 days) and the mean tumor volume change for 7 days (or histological findings). A total of 12 groups (6 groups per each tumor type) were untreated (served as control) or treated with anti-EMMPRIN antibody, cisplatin, X-ray irradiation, anti-EMMPRIN antibody plus cisplatin, and anti-EMMPRIN antibody plus X-ray irradiation. Data of SCC1 tumors treated with X-radiation monotherapy were indicated with black diamonds, while the others were with gray circles. Pearson correlation coefficients and p values were found when X-ray treated SCC1 data were included (listed above) or excluded (listed below).

