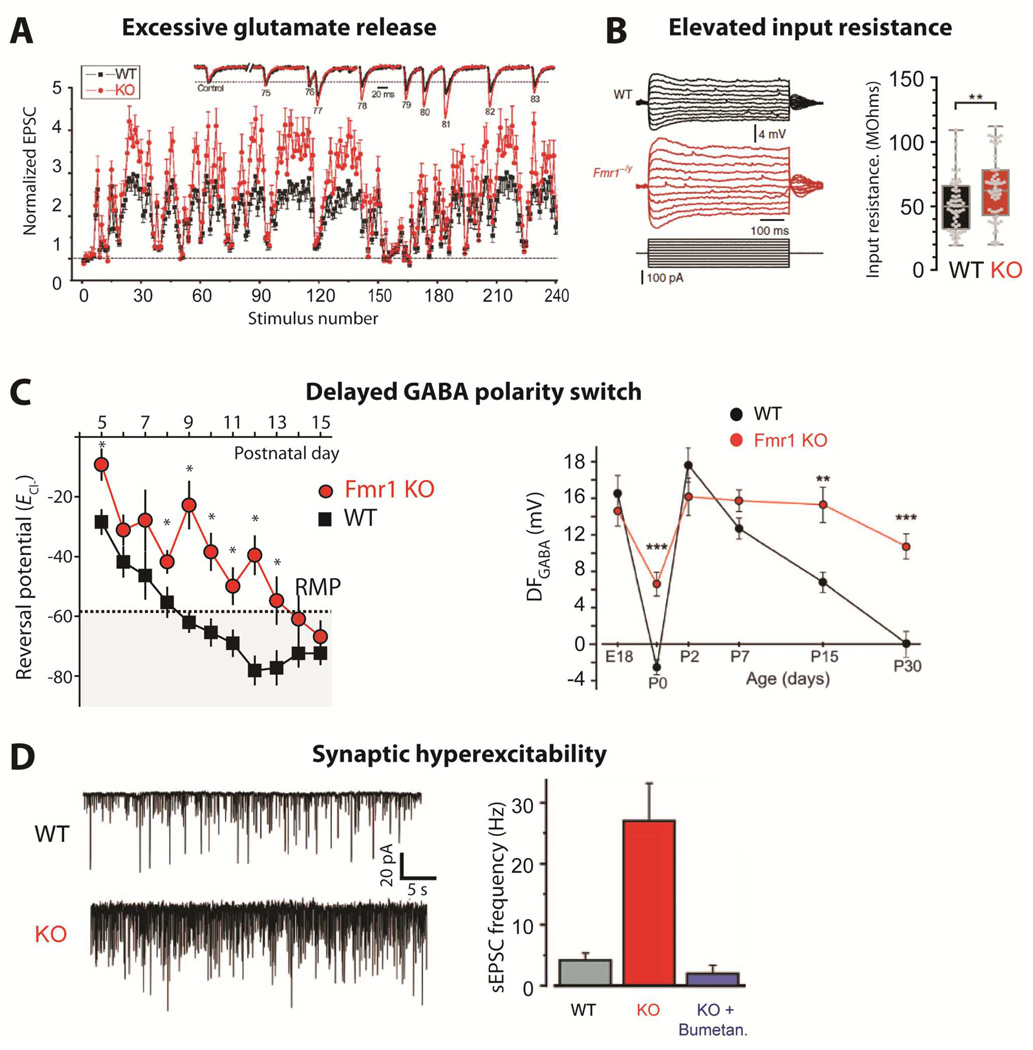
Figure 3. Synaptic hyperexcitability.
-
(A)Changes in synaptic strength during natural stimulus trains plotted as a function of stimulus number for WT and Fmr1 KO mice. Inset shows EPSCs 75–83 during the natural stimulus trains, scaled to their own controls for comparison. (from Deng et al., 2011).
-
(B)Dendritic input resistance is increased in cortical L5 pyramidal neurons of Fmr1 KO mice [from Zhang et al., 2014].
-
(C)Delayed GABA polarity switch. Left, ECl- remains depolarized in Fmr1 KO mice during cortical development. Average ECl- calculated from individual recordings plotted against the age of the mouse. The resting membrane potential (RMP) measured at P10 is denoted by the dashed line and shaded area represents points at which GABA would have a mature hyperpolarizing response. *p < 0.05 [from He et al., 2014]. Right, Age-dependence of the driving force of GABA-A receptor (DFGABA) in neurons from control and Fmr1 KO mice [from Tyzio et al., 2014]
-
(D)Spontaneous activity is increased in Fmr1 KO mice at P15. Left, representative traces of whole-cell voltage clamp recordings of sEPSCs at –70 mV from individual hippocampal CA3 pyramidal neurons in acute brain slices. Right, Average values of sEPSC frequencies are higher in Fmr1 KO mice, but are normalized by treatment with bumetanide at birth. [from Tyzio et al., 2014]

