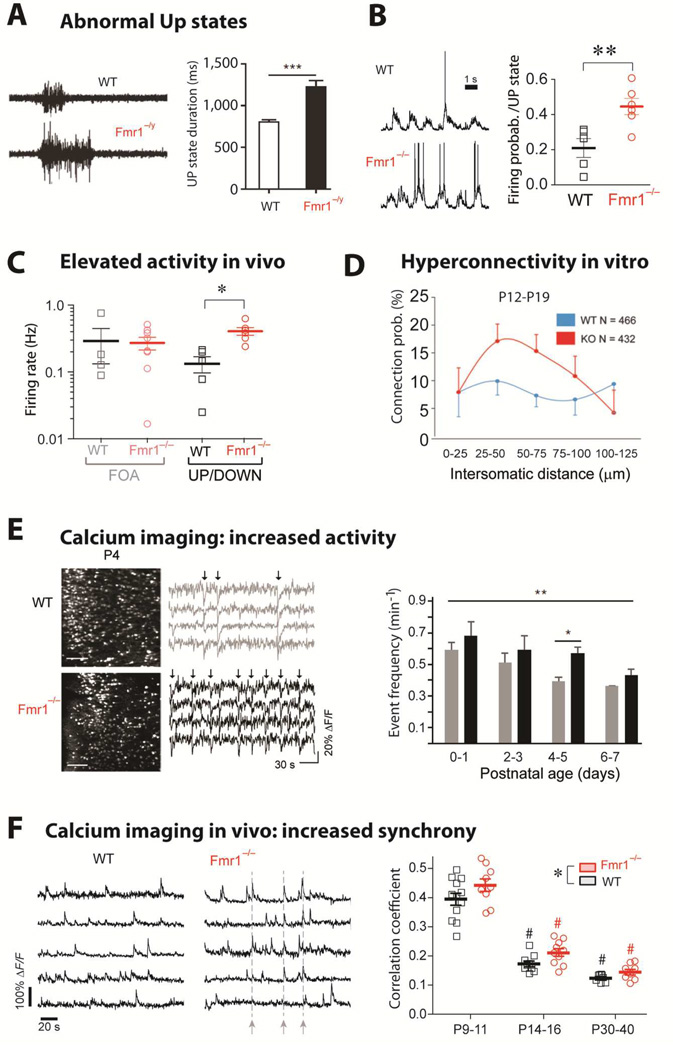
Figure 4. Circuit hyperexcitability: UP states, firing, synchrony.
-
(A)Left, Representative extracellular multiunit recordings from L4 in slices from barrel cortex of WT and Fmr1−/y mice. Right, Group averages showing prolonged UP state duration in slices from Fmr1−/y mice (n = 22). [from Ronesi et al., 2012]
-
(B)Left, Sample traces from whole-cell patch-clamp in vivo recordings of L2/3 neurons during UP/DOWN states in unanesthetized WT and Fmr1−/− mice. Right, The mean firing probability during any given Up state (active or silent) was higher in Fmr1−/− mice (**p < 0.01, t-test). In contrast, the frequency and duration of Up states were the same in WT and mutant mice (not shown). [from Goncalves et al., 2013]
-
(C)Firing rates for L2/3 neurons are higher in Fmr1−/− mice compared to WT mice during in vivo whole-cell recordings showing UP/DOWN states (typical of sleep or quiet wakefulness), but not during fast oscillatory activity (FOA; typical of awake brain state). *p < 0.05. [from Goncalves et al., 2013]
-
(D)Hyperconnectivity of L5 pyramidal neurons in prefrontal cortex of 2–3 week old Fmr1 KO mice. Direct connections between neurons were tested at a range of distances using hexa-patch electrode recordings in brain slices. Connection probability distributions were significantly higher for clusters of Fmr1 KO neurons than for those of WT neurons (p < 0.01). The same analysis in 3–5 week-old mice did not reveal any significant differences. (from Testa-Silva et al., 2011)
-
(E)Hyperactive postnatal brain networks in Fmr1 KO mice. Left, representative two-photon images of acute coronal sections of the cortex at P4 from WT and Fmr1 KO mice that were loaded with the fluorescent calcium indicator Fura2-AM and corresponding sample traces for 4 neurons. Arrows indicate epochs of synchronous firing in the recording. Right, frequency of activity during development in WT and Fmr1 KO mice (**p = 0.024 across ages, and *p = 0.002 at P4–5) (from El Fata et al., 2014)
-
(F)Left, Calcium traces for 5 representative L2/3 neurons in barrel cortex of unanesthetized WT mice and Fmr1−/− mice at P14-16 showing synchronous bursts of cell firing (dashed lines) in the Fmr1−/− mouse. Right, Mean correlation coefficients for all cell pairs within 100 µm of each other for WT and Fmr1−/− mice at different postnatal ages. Both age and genotype significantly affected correlation coefficients,*p < 0.05). [from Goncalves et al., 2013]

