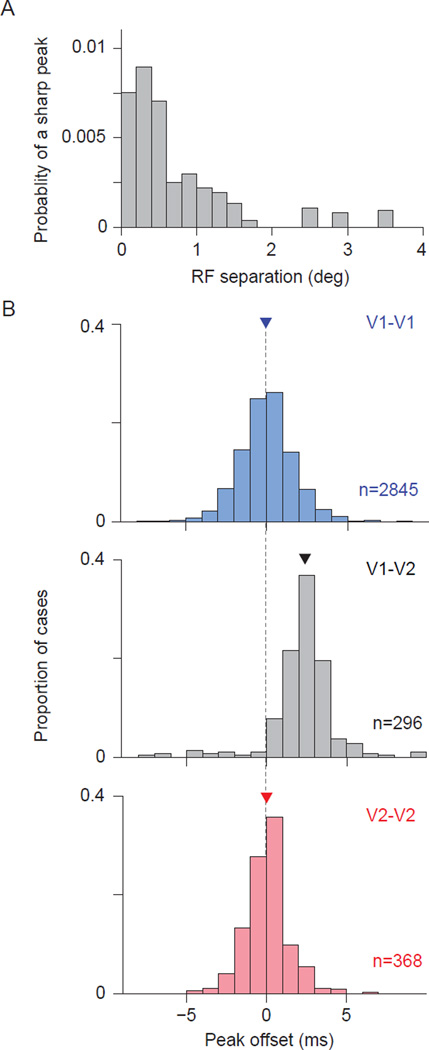
Figure 5. Properties of narrow V1-V2 CCG peaks.
(A) The probability of finding a significant narrow CCG peak, as a function of V1-V2 RF separation (center-to-center distance). (B) Temporal offset of the narrow V1-V1 (blue), V1-V2 (gray), and V2-V2 (red) CCG peaks. Only pairs with significant peaks are included. Thin vertical line is to facilitate comparison. Arrowheads indicate medians.

