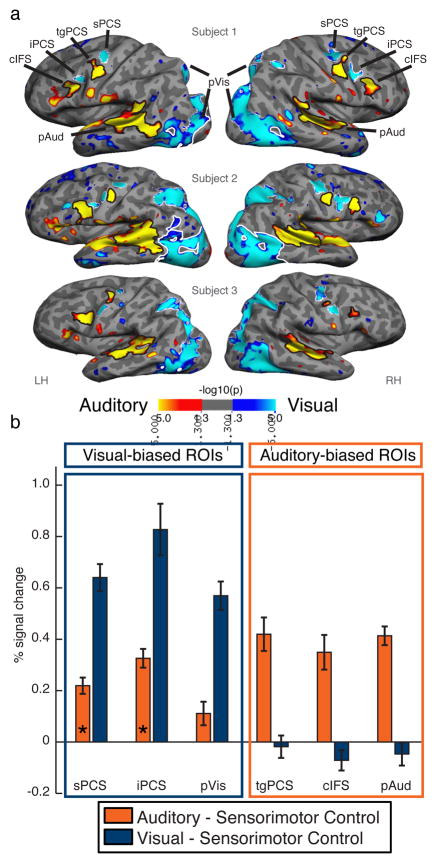
Figure 2.
Contrast of visual and auditory sustained spatial attention. (a) Statistical maps of 3 individual subjects showing significant differences in a direct contrast of blocks of auditory (hot colors) versus visual (cool colors) sustained spatial attention are overlaid onto cortical surface renderings (sulcus = dark gray; gyrus = light gray). Black and white outlines represent ROI definitions for auditory- and visual-biased ROIs, respectively. Note the interdigitated pattern of auditory and visual bias in the caudal lateral frontal cortex. LH = left hemisphere, RH = right hemisphere, sPCS = superior precentral sulcus, tgPCS = transverse gyrus intersecting the precentral sulcus, iPCS = inferior precentral sulcus, cIFS = caudal inferior frontal sulcus. (b) Average percent signal change (n = 9) relative to sensorimotor control for auditory spatial attention and visual spatial attention conditions. Statistical comparisons between auditory spatial attention and visual spatial attention conditions are not included, as ROIs are defined by their direct contrast.

