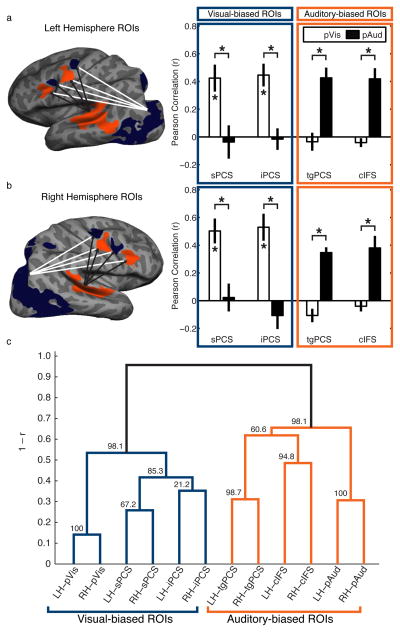
Figure 3.
Group-averaged intrinsic functional connectivity (Experiment 2). (a,b) Within-hemisphere (left, right) average of Pearson correlation between resting-state time courses of each frontal ROI and the visual-biased pVis (white) and auditory-biased pAud (black) ROIs showing planned statistical comparisons. Brain images show the ROIs from one subject and illustrate which functional connectivity relationships were tested. Frontal ROIs are grouped (blue and orange boxes) by sensory-bias demonstrated in Experiment 1. The intrinsic functional connectivity pattern confirms the key finding of Experiment 1 that interleaved frontal areas participate in attentional networks strongly biased for sensory modality. Mean correlation from 9 subjects; error bars reflect s.e.m. (c) Hierarchical cluster tree based on the (1–r) distance matrix between all 12 ROIs. Values in black indicate confidence based on percentage of 1000 bootstrap average matrices matching each subtree.

