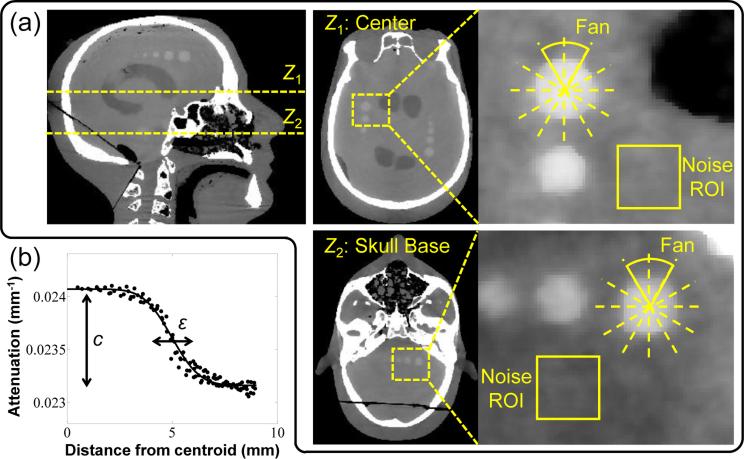
Figure 3.
Illustration of image quality metrology. (a) Two axial slices in which the spatial resolution, noise, and contrast-to-noise ratio (CNR) were computed. The spatial resolution and contrast were computed by fitting an edge spread function (ESF) to voxel values in 60° fans centered on a sphere of contrast equivalent to blood. Noise was computed as the standard deviation of voxel values in a homogeneous ROI immediately adjacent to the sphere. (b) Example sigmoid fit to the measured ESF, from which spatial resolution was characterized in terms of the ESF width, ε, and contrast was given by the parameter c.

