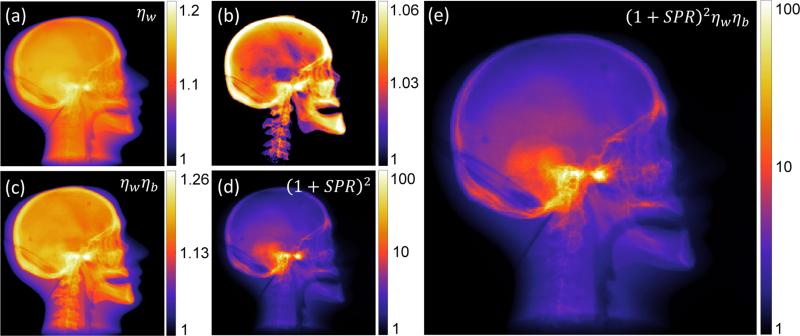
Figure 4.
Example illustration (in a lateral projection view) of the change in variance associated with each step of artifact correction. The change in variance is shown for corrections associated with: (a) beam hardening correction for water (ηw); (b) beam hardening correction for bone (ηb); (c) total beam hardening correction (ηw ηb); (d) scatter correction (1+SPR)2; and (e) all scatter and beam hardening corrections.

