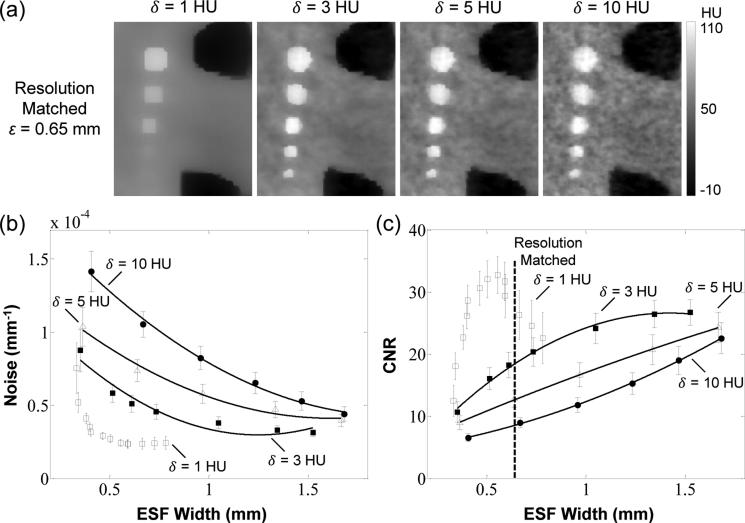
Figure 5.
Selection of regularization parameters with respect to noise-resolution tradeoffs. (a) PWLS* images in a ROI in the Z1 axial slice using different δ values. Images were reconstructed using the fully-corrected dataset with spatial resolution matched at ε = 0.65 mm. (b-c) Noise-resolution tradeoff and CNR-resolution tradeoff for PWLS* using different δ values. The error bars are based on the standard deviation of the noise in 6 neighboring axial slices. The solid curves are second-order polynomial fits intended merely as a guide to trends evident in the underlying data points. A value of δ = 5 HU was selected as a conservative choice giving a reasonable level of noise reduction and edge preservation without introducing an unnatural appearance of patchy over-regularization.

