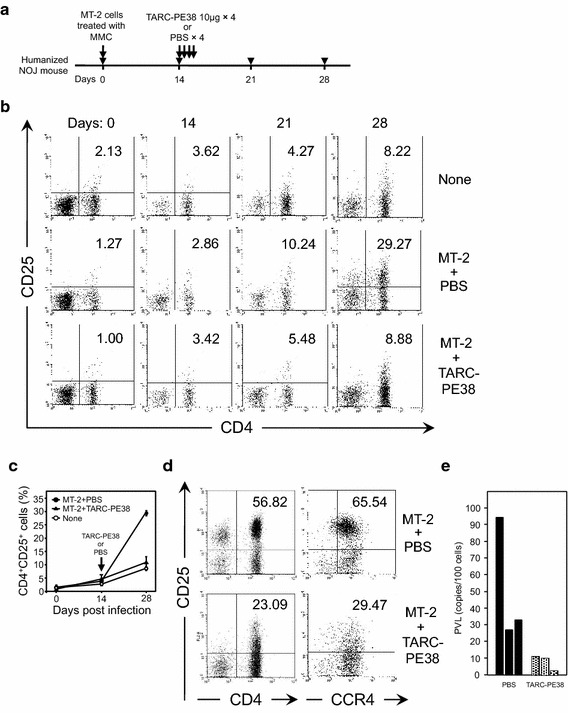
Fig. 3.

Antiviral effect of TARC–PE38 on HTLV-1 infection in humanized mice. a CD34+ HSCs were purified from human cord blood and transplanted intrahepatically into newly born NOJ mice. After these mice were humanized, nine mice were inoculated intraperitoneally without (n = 3, PBS only) or with MT-2 cells treated with MMC (n = 6) (day 0). Two weeks later, either 10 μg of TARC–PE38 or PBS was administered to the HTLV-1-infected mice (three mice in each group) intravenously once a day for four successive days (days 14–17). All mice were observed for more than 2 weeks after the administration of TARC–PE38 or PBS, and bled on days 0, 14, 21, 28, and later. b To assess the therapeutic effect of TARC–PE38 on HTLV-1-infected cells, peripheral blood was obtained from all the mice described above. The PBMCs were isolated and the frequency of human CD4+CD25+ cells was determined with flow cytometry. The data are representative of each group as follows: none, uninfected untreated mice; MT-2 + PBS, HTLV-1-infected mice treated with PBS; MT-2 + TARC–PE38, HTLV-1-infected mice treated with TARC–PE38. The number indicated in the upper right quadrant is the frequency of human CD4+CD25+ cells (%). c The frequencies of human CD4+CD25+ cells (%) on the indicated days after infection are plotted for each mouse group: none (open circles), MT-2 + PBS (closed circles), or MT-2 + TARC-PE38 (closed triangles). The data are expressed as means ± SD (%). d To determine the effect of TARC-PE38 on CD4+CD25+ or CD4+CD25+CCR4+ cells, PBMCs obtained from each mouse group (MT-2 + PBS or MT-2 + TARC-PE38) after day 28 were checked for the frequency of human CD4+CD25+ cells (left panels) or CD4+CD25+CCR4+ cells (right panels) by flow cytometry. The number indicated in the upper right quadrant is the frequency of human CD4+CD25+ or CD4+CD25+CCR4+ cells (%). e PBMCs obtained on day 28 from MT-2-infected mice treated with PBS (black bar) or with TARC–PE38 (dotted bar) were also used to measure PVLs with quantitative PCR. The data are presented as copies/100 cells. These results are representative of two independent experiments
