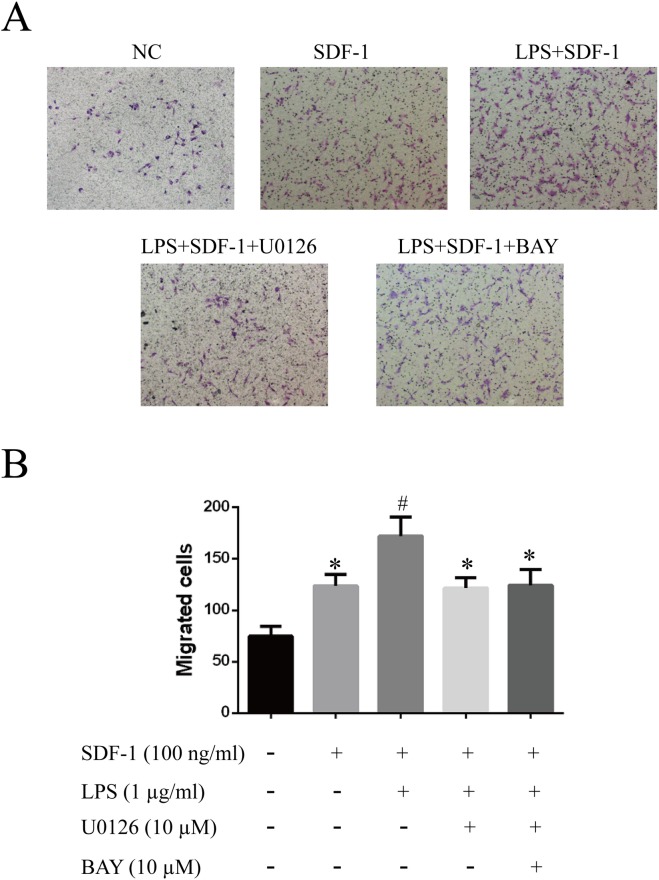
Fig 5. Effects of LPS on the SDF-1-induced migration of RF/6A cells.
The migratory activity of RF/6A cells after different treatments was estimated based on the number of cells that migrated through the filter inserts. Representative images of cell migration are given: untreated (A); SDF-1 (100 ng/ml) alone in the lower chamber (B); LPS (1 μg/ml) pretreatment plus SDF-1 (100 ng/ml) in the lower chamber (C); combined LPS and U0126 pretreatment plus SDF-1 in the lower chamber (D); combined LPS and BAY 11–7082 pretreatment plus SDF-1 in the lower chamber (E). (F) Quantitative analysis of the number of migrated cells, expressed as the mean ± SD. Statistical significance determined using one-way ANOVA with *P < 0.05, **P < 0.01.

