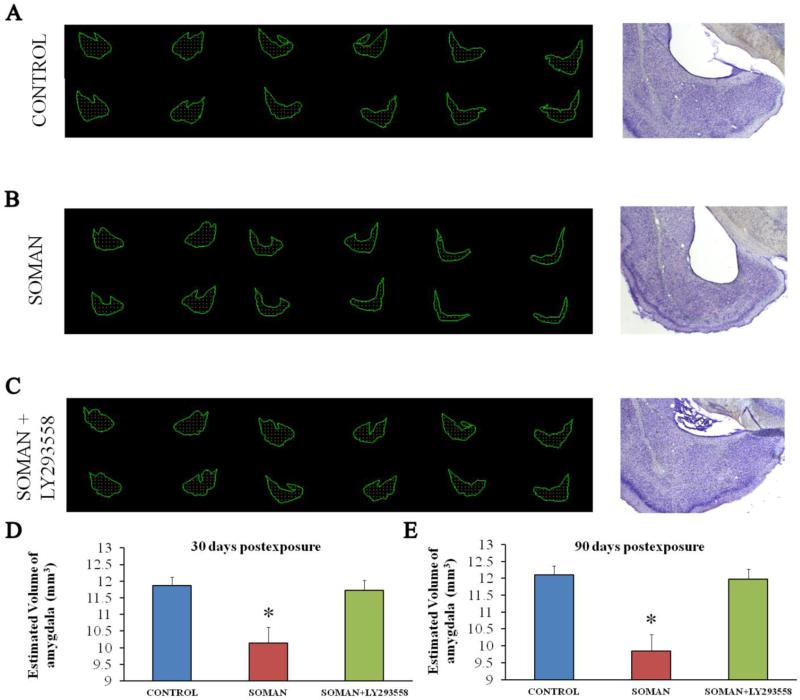
Figure 8. A reduction in amygdalar volume, 30 and 90 days after soman exposure, is prevented by LY293558 treatment.
A, B, C. Tracings of the amygdala in series of slices (left) and representative photomicrographs (right) from control animals (A, n = 8), soman-exposed animals that received only ATS (0.5 mg/kg) and HI-6 at 1 min post-exposure (B, n = 8), and soman-exposed animals that received LY293558 (20 mg/kg) at 1 h after soman injection (C, n = 8). D. Group data showing the estimated volume of the amygdala for all three groups, 30 days after the exposure. E. Group data showing the estimated volume of the amygdala for all three groups, 90 days after the exposure. *p < 0.05 (ANOVA, LSD post-hoc test).

