
Figure 4.
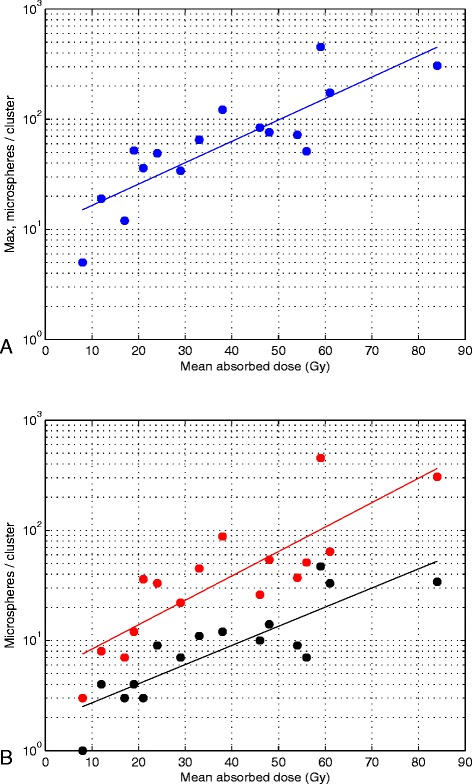
Exponentially increasing cluster size with increasing mean absorbed dose. (A) The largest cluster size in each of the 16 biopsies and the corresponding trendline for exponential increase (R2 = 0.70, p < 0.05, two-sided t test), from approximately 16 spheres per cluster at 10 Gy to 400 spheres per cluster at 80 Gy. (B) The spheres are divided into three cluster size intevals in which the spheres in the biopsies were gathered. Twenty-five percent of the microspheres for a specific mean absorbed dose were found within clusters of the same size or smaller than the level indicated by a black dot, 25% of the microspheres were found within the cluster size interval between the absorbed-dose-specific black dot and the corresponding absorbed-dose-specific red dot, and the remaining 50% of the microspheres were found within clusters of the same size or larger than the size indicated by the absorbed-dose-specific red dot. The cluster size levels increase exponentially with the mean absorbed dose in the biopsies (black dot level: R2 = 0.72, p < 0.05, two-sided t test; red dot level: R2 = 0.70, p < 0.05, two-sided t test).