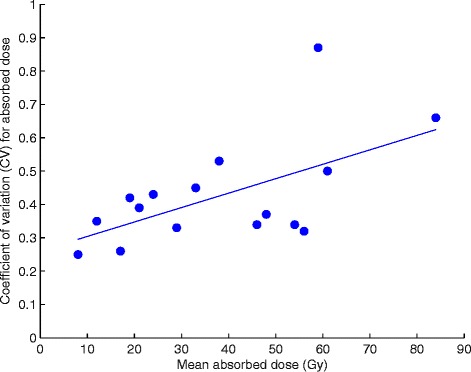
Figure 7.

The CV of absorbed dose increasing with mean absorbed dose. The 16 separate absorbed dose simulations were based on cluster distribution patterns of the microscopic sub-samples, but added up to the mean absorbed dose within the entire 16 biopsies, the latter based on activity measurements with gamma well chamber. The resulting graph shows a linear increase of CV of absorbed dose, with mean absorbed biopsy dose (R2 = 0.34, p < 0.05, two-sided t test).
