Figure 3.

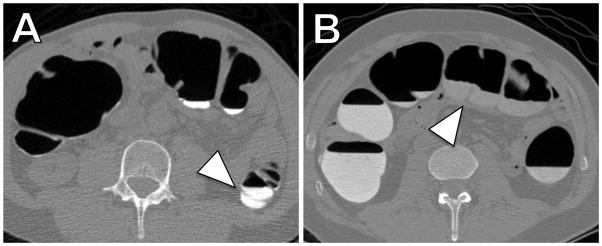
CTC examinations in two patients receiving the new OSS regimen (A) and the established sodium phosphate regimen (B). (A) Axial two-dimensional CTC image from a 62-year-old man who underwent OSS regimen illustrates the calculated low total residual fluid volume (89 ml) with high attenuation (897 HU). (B) Axial two-dimensional CTC image from a 58-year-old man who underwent sodium phosphate regimen illustrates the calculated high residual total fluid volume (853 ml) with low attenuation (440 HU). Note the good conspicuity of colonic fold against the high attenuation fluid after OSS regimen (A, arrow head) as compared to poor conspicuity of a fold against the low attenuation fluid after MgC regimen (B, arrowhead). Both cases also illustrate the inadequacy of the established manual fluid volume and attenuation quantification methods. In (A) the volume of descending colon occupied by fluid would be rated > 50%, albeit this is not due to high fluid volume, but rather due to poor overall distension. In (B) the different attenuations of the fluid within the colon are clearly evident and indicate the sampling error of manual ROI-based methods for attenuation quantification.
