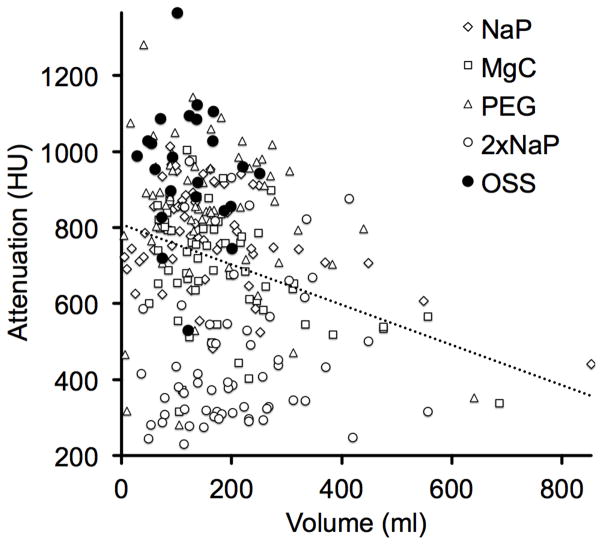
Figure 5.
Automated volumetric QA tool reveals inverse correlation between volume and attenuation of residual colonic fluid. Graph depicts residual fluid attenuation plotted against the fluid volume across all different cathartic agents. As residual fluid volume increases, the degree of fluid attenuation decreases. Correlation is r= −0.262 (p<0.0001). OSS regimen generally yielded low residual volume with high attenuation (filled dots).

