
Figure 2.
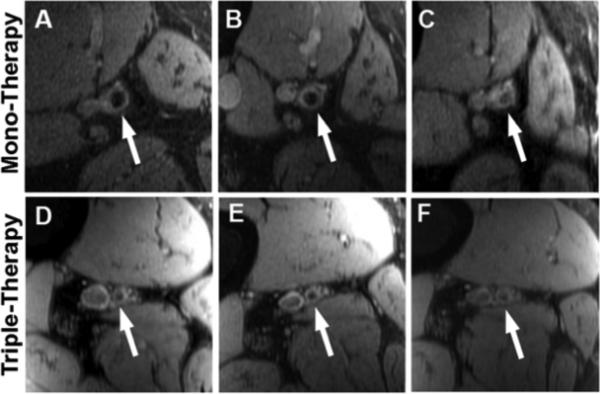
Cross-sectional MRI images of the superficial femoral artery (SFA). Panels A-C: SFA at baseline (A), 12-months (B) and 24-months (C) for a patient from the mono-therapy group. Panels D-F: SFA at baseline (D), 12-months (E) and 24-months (F) for a patient from the triple-therapy group.