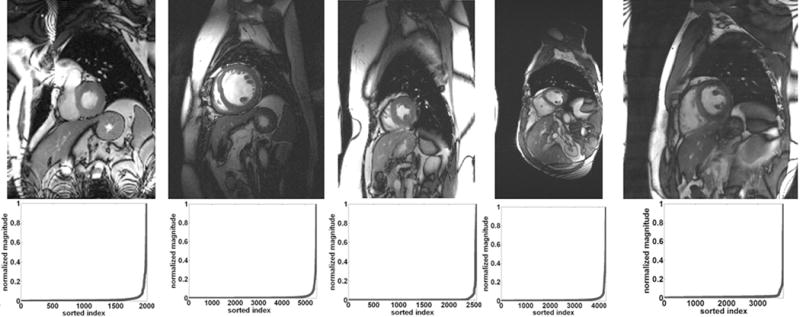
Fig. 1.

Top row shows a single frame reconstructed from the fully sampled data. The bottom row shows plots of the magnitude of the normalized and sorted signals in x-f space for a given position in the frequency-encoding direction. Three different datasets with five coils (left), a single coil (middle), and four coils (right) were used.
