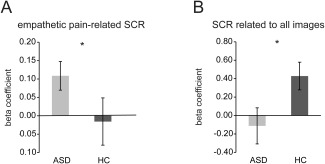
Figure 3.

Skin conductance response (SCR). (A) ASD group showed increased SCR to painful images compared to HC group. (B) SCR related to viewing all images was significantly lower in the ASD group compared to HC group. * P < 0.05. ASD, autism spectrum disorder; HC, healthy controls. Error bars indicate standard errors of the mean.
