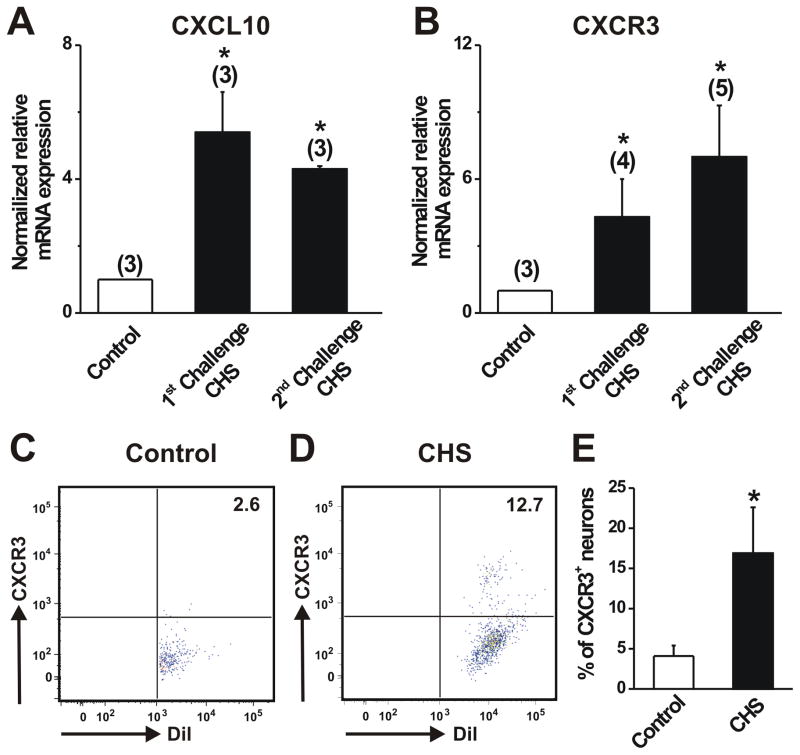
Figure 1.
Effects of CHS on the expression of CXCR3 and its ligand CXCL10 in DRG. A–B, Quantitative RT-PCR showed a significant increase in the mRNA expression levels of CXCL10 and CXCR3 in L3–L5 DRG from CHS mice compared to those from acetone-treated control animals. The number of animals in each group is given in parentheses. * p < 0.05, CHS vs. control, unpaired t test. C–D, Representative scatter plot depicting the expression of CXCR3 on the surface of the Dil-labeled cutaneous DRG neurons obtained from control (acetone-treated) and CHS (SADBE-treated) mice 24 h after the 2nd challenge. DRG neurons were stained with monoclonal antibody against CXCR3. The number in the upper right corner of each box indicates the percentage of DiI-labeled neurons stained with CXCR3. E, FACS analysis revealed that the mean percentage of DRG neurons stained with CXCR3 from CHS mice was significantly greater as compared to control animals. Twelve mice were used per condition. *p < 0.05 versus control, Fisher’s exact test.

