Figure 4.
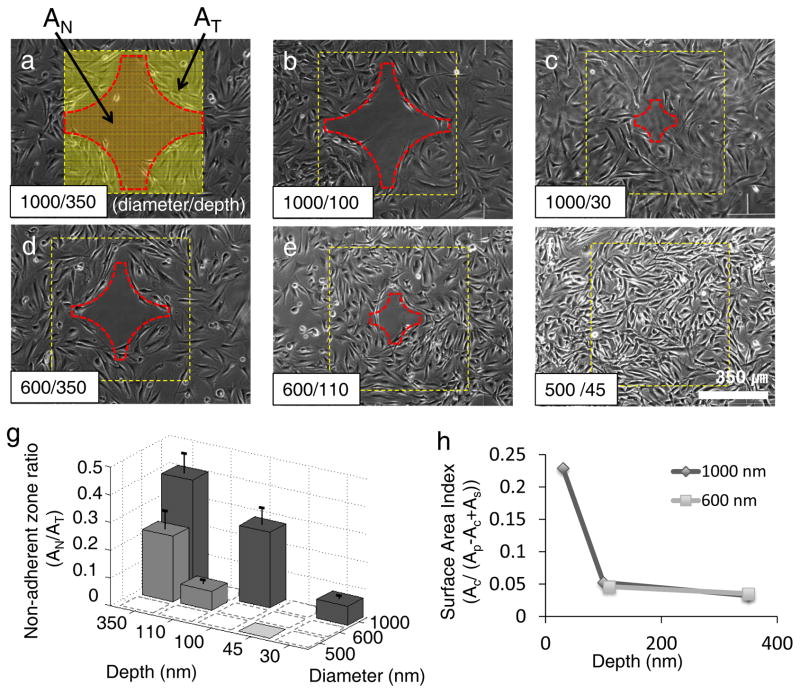
Effect of nanocrater size on cell migration and formation of a cell repellant zone. a–f, Phase-contrast images of cell migration 25 hours after cell seeding on spacing-gradient patterns with 6 different nanocrater dimensions (diameter nm/ depth nm): 1000/350, 1000/100, 1000/30, 600/350, 600/110 and 500/45. The squares represent the patterned region, and the cross medal shaped region at the center of the patterned area represents the cell repellant zone. The area of the repelling zone was dependent on the nanocrater dimensions. Clear boundary lines of the repellent region formed for all samples except f, the sample of 500 nm in diameter and 45 nm in depth. g, Non-adherent zone ratio was defined as “the area of repelling zone (AN) / the total area of patterned surface (AT) (See Fig. 4a).” The non-adherent zone ratio decreased with decreasing nanocrater diameter and depth. Dashed-line squares mean no experimental data, and error bars represent standard deviations of repeated experiments. h, Surface Area Index (SAI) is defined as a ratio of the crater area versus surface area (Ac/(Ap-Ac+As) at the boundary of cell-adhesion repellent zone (See Supplementary Fig. S6). The SAI changes depending on crater depth: increasing with increasing depth. However, nanocrater diameters above 600 nm do not show significant differences in SAI depending.

