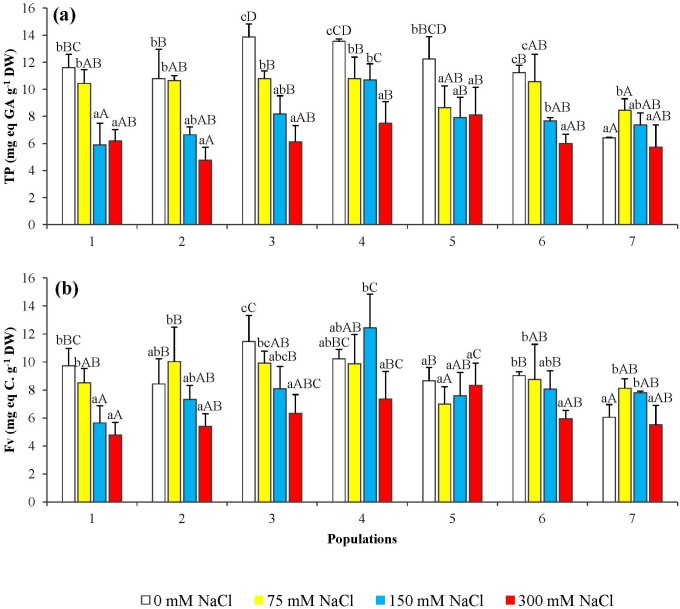
Fig 10. Total phenolic compounds (TP) (a) and total flavonoids (Fv) (b) levels in seedlings from the seven P. abies populations, after 6-week treatments with the indicated NaCl concentrations.
Means with SD (n = 3). For each population, different lowercase letters above the bars indicate significant differences among treatments and capital letters indicate significant differences among populations undergoing the same treatment, according to the Tukey test (α = 0.05).

