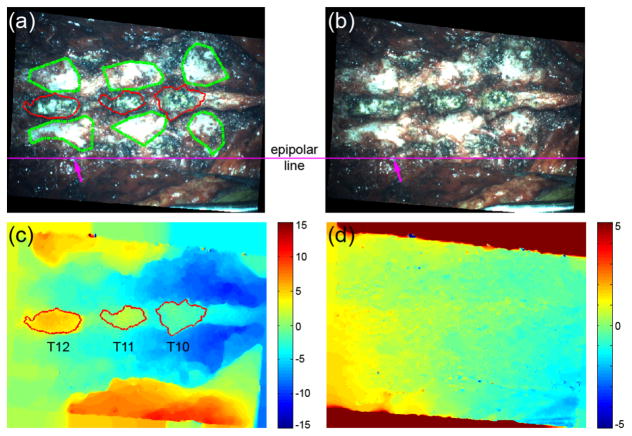
Fig. 2.
The rectified (a) left and (b) right images of the spine for patient 2 and the resulting (c) horizontal and (d) vertical disparity maps. The spinous processes were automatically segmented via a region growing approach based on the horizontal disparity map (red boundaries in (a) and (c)), while other bony areas on the transverse processes were manually delineated (green boundaries in (a)). (d) The vertical disparity map indicates the confidence in correspondence matching as a result of the epipolar constraint. A typical epipolar line is shown in (a) and (b), demonstrating homologous features are aligned on the same horizontal line (arrows; i.e., “ground-truth” vertical disparity of zero). Units in pixels (images down-sampled to 25% along each dimension for illustration).

