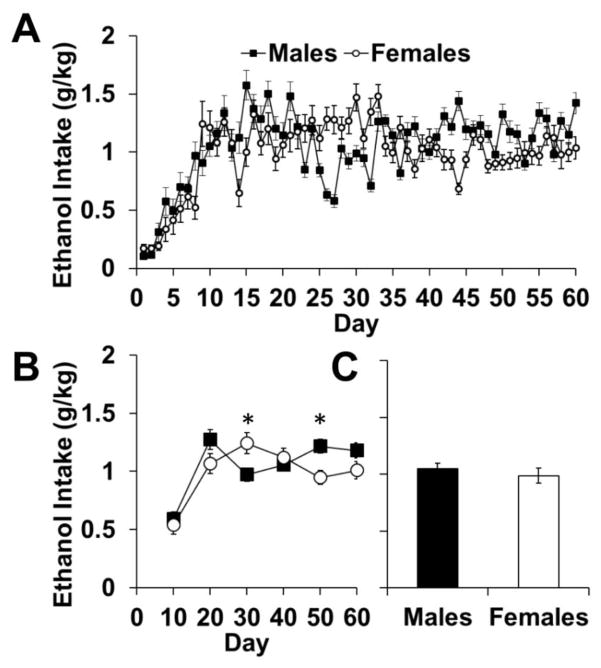
Fig. 4.
Ethanol self-administration under a fixed ratio 1 schedule of reinforcement. (A) Data are plotted as mean (± SEM) daily ethanol consumption (g/kg) for each daily testing session. (B) Data are plotted as mean (± SEM) daily ethanol consumption (g/kg) for blocks of 10 days each. (C) Data are plotted as the mean (± SEM) ethanol preference of all 60 days of FR1 ethanol consumption. An asterisk (*) represents a significant difference between males (n=23) and females (n=23; p<0.05).

