
Figure 1. Fetal Macrophages Arise Sequentially from YS Macrophages and Fetal Monocytes.
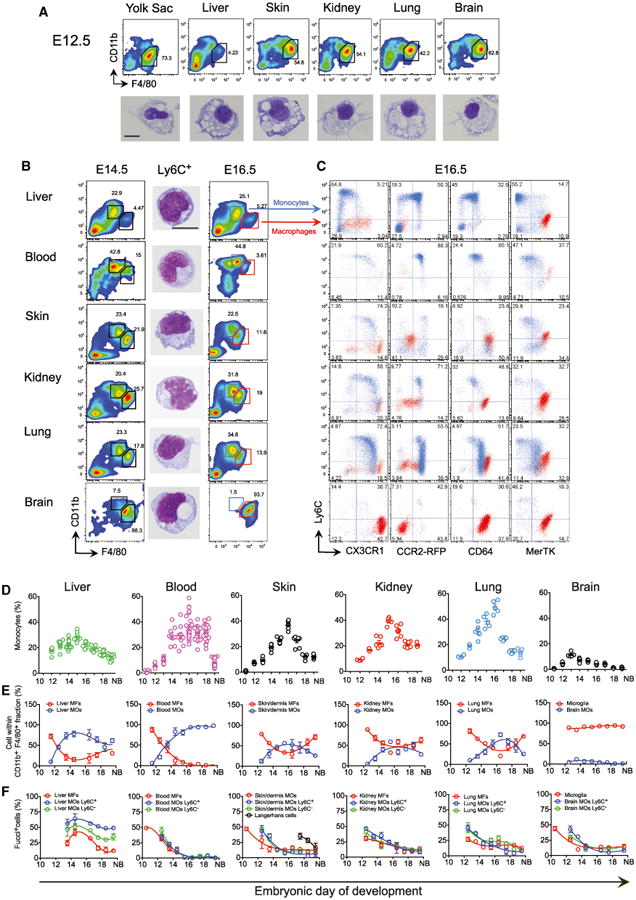
(A) Flow cytometry analysis of cells from E12.5 embryonic tissues and GIEMSA staining of purified doublet−DAPI−CD45+CD11bloF4/80hiCD64+Ly6C−YS MFs from each tissue.
(B) Flow cytometry analysis of cells from E14.5 and E16.5 embryos and GIEMSA staining of purified doublet−DAPI−CD45+CD11bhiF4/80loCD64+Ly6C+ MOs from each E14.5 tissue. (A and B) Scale bar represents 5 μM.
(C) Flow cytometry analysis of cells from E16.5 Cx3cr1+/gfp, Ccr2+/rfp, and WT embryos. Overlay of MFs (red population) and fetal MOs (blue population) is depicted (see also Figure S1A for FL analysis). Representative data from five embryos from two litters of each strain are shown.
(D) Kinetics of fetal MO tissue infiltration. Percentage of fetal CD11bhiF4/80loCD64+Ly6C+/− MOs within doublet−DAPI−CD45+ cells on alternate days of embryonic development (see also Figure S1B for CCR2−/− data). Each dot represents one embryo (n = 5–12).
(E) MFs gated as in (A) and fetal MOs gated as in (B) within total CD11b+F4/80+ cells (n = 5–12).
(F) Percentage of proliferative MFs gated as in (A), Ly6C+ and Ly6C− MOs gated as in (B) determined in Fucci reporter mice (see Supplemental Information, n = 5–8) (see also Figure S2A for representative plots). Mean ± SEM from three independent litters is presented in (D)–(F).