
Figure 2. YS Macrophages Are Not Essential for Fetal Macrophage Development.
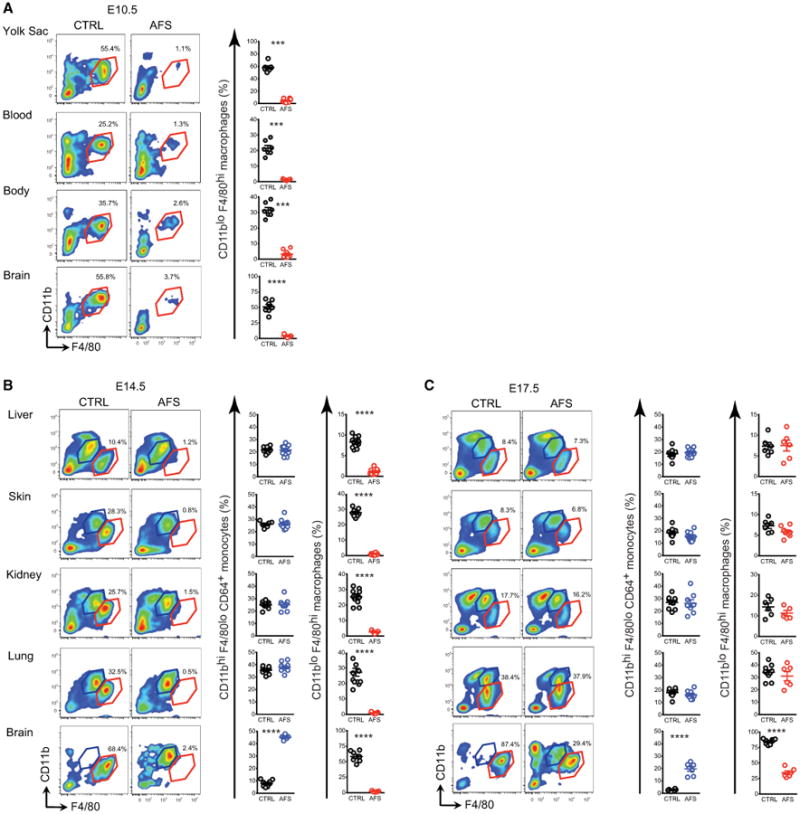
(A–C) Pregnant females were untreated or injected with AFS98 at E6.5 and cells from embryos were analyzed by flow cytometry at E10.5 (A), E14.5 (B), and E17.5 (C). Percentages of MFs (red) and fetal MOs (blue) gated as in Figure 1 are shown. Each dot represents one embryo. Bars represent mean ± SEM (*p < 0.05; **p < 0.01; ***p < 0.001; ****p < 0.0001). Analysis of n = 5–12 embryos per group from 2–3 independent litters (see also Figure S2B).