
Figure 3. YS Macrophages in Embryonic Tissues Are Progressively Replaced by Fetal Monocyte-Derived Macrophages.
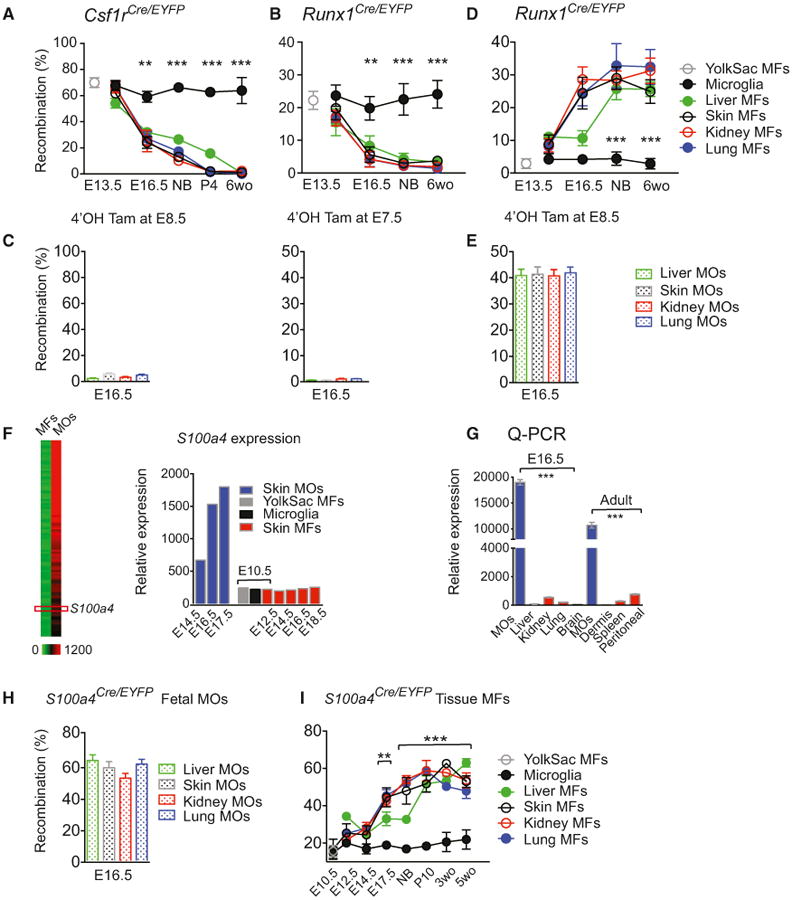
(A–E) Fate-mapping of YS MFs and fetal MOs from early development into adulthood (6 weeks old). Percentage of recombination in MFs at various time points (A), (B), and (D) or MOs at E16.5 (C) and (E) after a single injection of 4′OHT at E8.5 in Csfr1Cre/WT pregnant mice (A, C, left) (two pooled experiments, n = 5–12 for each time point), or at E7.5 (B, C, right) (three pooled experiments, n = 8–16, for each time point), or E8.5 (D) and (E) (two pooled experiments, n = 5–16 for each time point) in Runx1Cre/WT pregnant mice.
(F) Heatmap depicting differentially expressed genes (DEG) in fetal MOs (See Supplemental Information and Figure S3A) and representative histograms of relative S100a4 mRNA expression in MOs and MFs by gene array analysis. (G) S100a4 mRNA expression determined by Q-PCR in MFs and fetal MOs(n = 3, each sample derives from at least eight embryos or five adult mice respectively). (H and I) Percentage of recombination in MOs at E16.5 (two pooled experiments, n = 5–10) (H), and in MFs (two pooled experiments, n = 5–10 for each time point) (I) of S100a4Cre/eyfp embryos and adult mice (see Figures S3B and S3C for controls). Bars represent mean ± SEM (*p < 0.05; **p < 0.01; ***p < 0.001).