
Figure 4. Fetal Monocytes Arise from HSC-Independent and -Dependent Pathways.
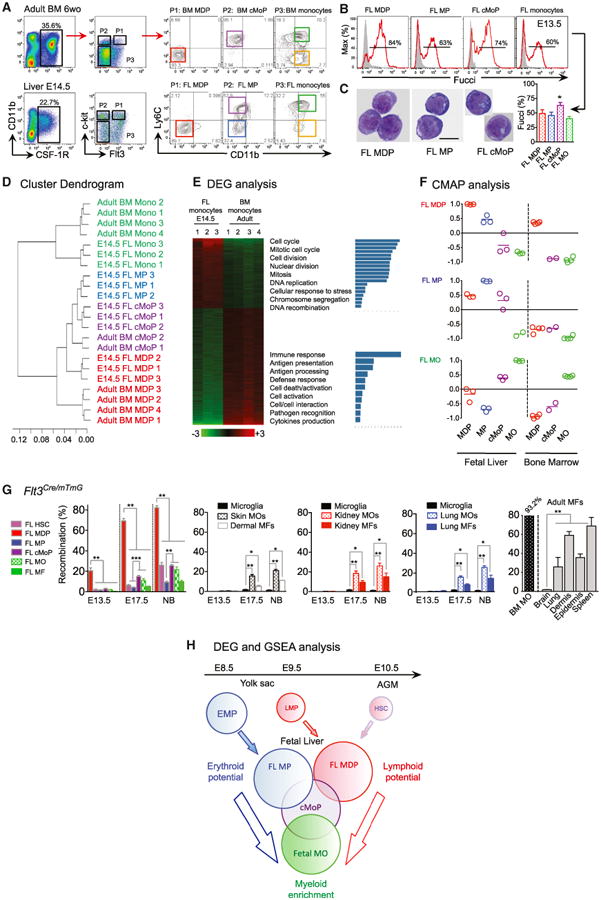
(A) Gating strategy (from doublet−DAPI− cells) for myeloid progenitor identification in adult BM and E14.5 FL: MDP (Pt, then red gate), MP (P2, then blue gate), cMoP (P2, then purple gate), fetal Ly6C+ MOs (P3, then green gate) and Ly6C− MOs (P3, then yellow gate) (see other time point and phenotype in Figures S4A and S4B).
(B and C) Proliferative activity analyzed in Fucci-reporter mice (n = 3–6) (B) and morphology visualized by GIEMSA staining of corresponding sorted FL myeloid progenitors (scale bar represents 5 μM; two independent experiments).
(D) Unsupervised clustering analysis of E14.5 FL and adult BM myeloid progenitors.
(E) Heatmap of DEG between FL and BM MOs with specific gene functionalities annotated.
(F) CMAP analysis identifies FL MDP and FL MP as early progenitors, and cMoP as an intermediate, in generating fetal MOs (See also Figures S4C–S4E, Supplemental Information and Table S1).
(G) Percentage of recombination in Flt3Cre/mTmG embryos/mice for FL MDP, FL MP, FL cMoP, FL MOs, or FL MFs (left), in MOs and MFs in skin, kidney and lung compared to microglia (middle) and in adult MOs and adult tissue MFs (right). Throughout the figure, bars represent mean ± SEM (n = 3–6, two pooled experiments, *p < 0.05; **p < 0.01; ***p < 0.001).
(H) Scheme representing fetal monopoiesis based on GSEA of each FL progenitor DEG combined with CMAP analysis (see also heatmap of FL myeloid progenitors DEG in Figure S4E, Tables S2 and S3 for GSEA details and Figure S4D for myeloid gene heatmap).