
Figure 5. c-Myb+ EMPs Colonizes the Fetal Liver and Give Rise to Monocytes.
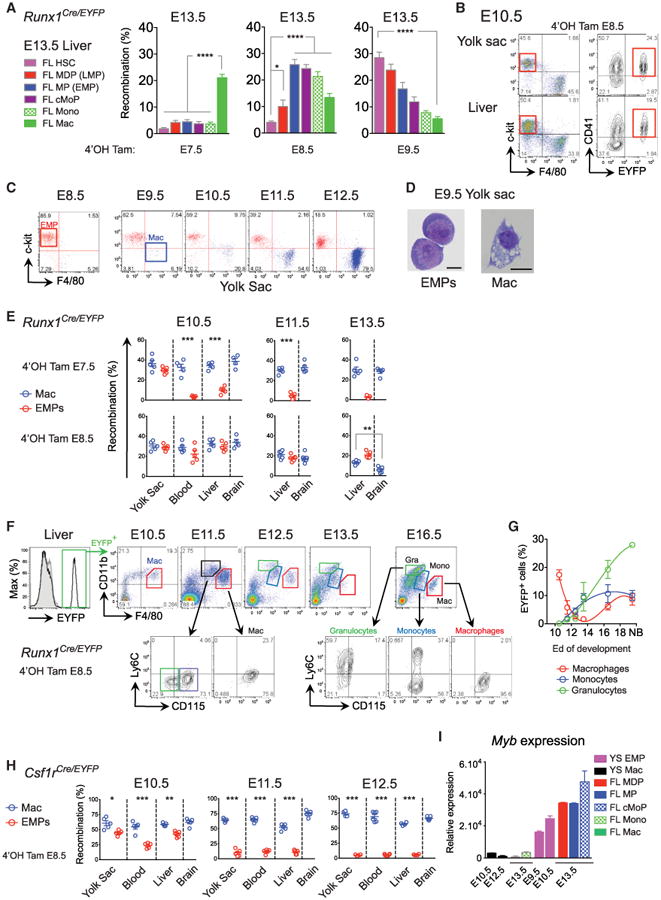
Runx1Cre/eyfp embryos activated either at E7.5, E8.5 or E9.5. Percentage of recombination in FL HSC, MDP, MP, cMoP, MOs, and MFs (two pooled litters, n = 7–13) (A) and in YS CD41+ EMPs (B) (see also Figure S5 for gating strategy, pre-HSC, and EMP analysis).
(C) The YS from E8.5 to E12.5 embryos were analyzed by flow cytometry for presence of c-Kit+ progenitors and F4/80+ MF.
(D) E9.5 EMPs (doublet−DAPI−CD11b−F4/80−c-Kit+CD41+) and YS MFs (doublet−DAPI−CD11b+F4/80+) were sorted and visualized by GIEMSA staining.
(E) Runx1Cre/eyfp embryos were activated at E7.5 (upper panels) or E8.5 (lower panels). Recombination profile in YS, blood and FL and brain MFs (blue) or EMPs (red) at E10.5, E11.5, and E13.5 are shown (n = 5–6 from two experiments).
(F) EYFP+ EMPs from Runx1Cre/eyfp activated at E8.5 and EMP progeny were followed in the FL during development. Primitive MFs (red), fetal MOs (blue), and granulocyte (green) generation is depicted.
(G) Quantification of MFs (red), fetal MOs (blue), and granulocytes (green) during development (n = 5–12 embryos from two independent experiments).
(H) Csf1rCre/eyfp embryos were activated at E8.5. EYFP recombination at E10.5, E11.5, and E12.5 in YS, blood, FL and brain MFs (blue), or EMPs (red) are shown (n = 5–6 from two experiments).
(I) YS EMP, YS MF, FL myeloid progenitors, MOs, and MFs were sorted and c-Myb mRNA expression was measured by Q-PCR. Data are represented as mean ± SEM from triplicate samples where each sample was comprised of at least eight embryos. Throughout the figure, each dot represents one embryo; bars represent mean ± SEM (*p < 0.05; **p < 0.01; ***p < 0.001).