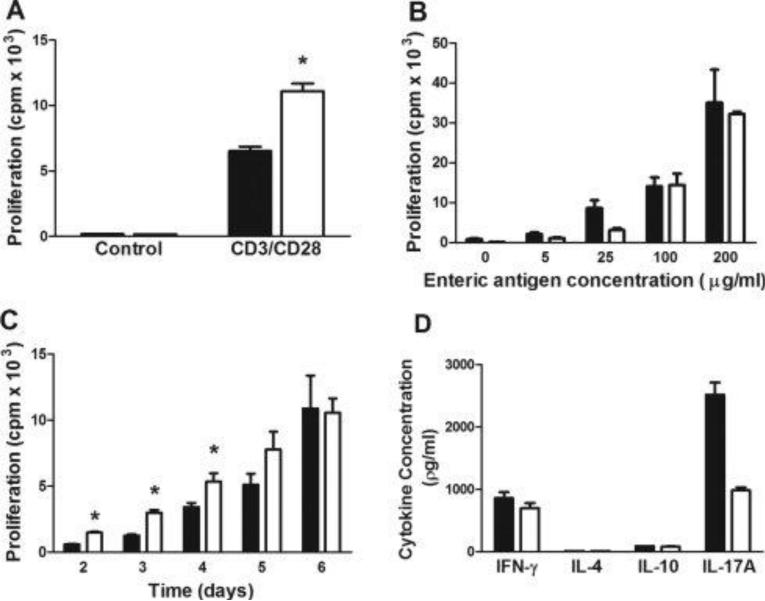
Figure 1. Activation of wild type or CD11a−/− T-cells in vitro.
(A). Wild type (WT; black bars) or CD11a−/− (white bars) CD4+CD25− T-cells were incubated with plate-bound CD3 and soluble CD28 mAbs for 4 days and T-cell proliferation was quantified using incorporation of [3H]thymidine as described in the Methods section. (B) WT or CD11a−/− CD4+CD25− T-cells were co-cultured with enteric antigen (EAg)-pulsed, bone marrow-derived DCs (bmDCs) 6 days and T-cell proliferation quantified as described in (A). (C) Time-dependent proliferation of WT or CD11a−/− CD4+CD25− T-cells induced by EAg-pulsed bmDCs. (D) Protein levels of different cytokines produced following co-culture of EAg-pulsed bmDCs with WT or CD11a−/− CD4+CD25− T-cells for 6 days as described in B. Cytokines were quantified in the supernatants using ELISA. Black bars represent WT cells obtained from WT mice whereas white bars are cells taken from CD11a−/− mice. Data represent the mean±SEM from 3-4 independent experiments and *p<0.05 vs. WT T-cells.

