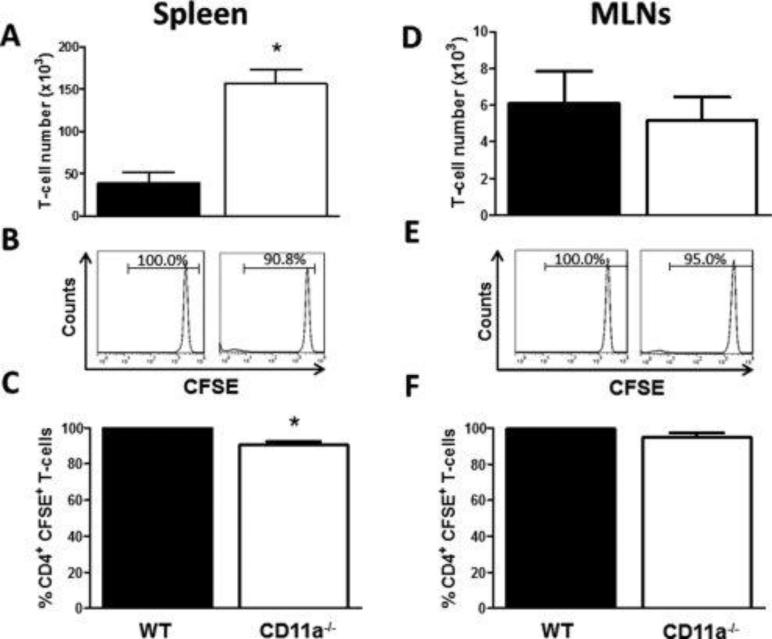
Figure 3. Accumulation and proliferation of wild type and CD11a−/− T-cells within the spleen and MLNs at 3 days following transfer into RAG-1−/− mice.
Congenically-marked, CFSE-labeled WT (45.1; black bars) and CD11a−/− (45.2; white bars) CD4+ T-cells were co-injected (iv; 107 cells each) into RAG-1−/− recipients. At 3 days following T-cell transfer, animals were sacrificed, T-cells were isolated from the indicated tissue, stained for CD4, CD45.1 and CD45.2 and analyzed by flow cytometry. (A) T-cell numbers within the spleen. (B) Representative histograms showing CFSE fluorescence of WT and CD11a−/− CD4+ T-cells. (C) Quantification of WT and CD11a−/− T-cells T-cell CFSE fluorescence. (D) T-cell numbers within the MLNs. (E) Representative histograms showing CFSE fluorescence of WT and CD11a−/− CD4+ T-cells. (F) Quantification of WT and CD11a−/− T-cell CFSE fluorescence. Black bars represent WT cells obtained from WT mice whereas white bars are cells taken from CD11a−/− mice. Data represent the mean±SEM for N=3 mice per group and *p<0.05 vs. WT T-cells.

