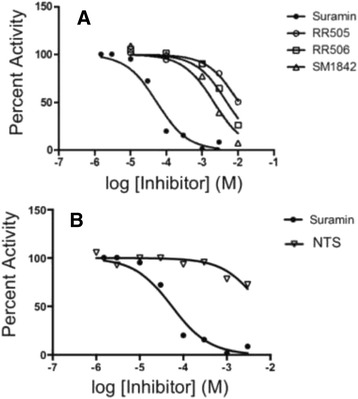
Fig. 4.

IC 50 Measurements. a DUSP5 PD(WT) initial velocity versus inhibitor concentration, and fitted to equation 3 to obtain IC50 values (Table 1). Conditions were as described for Fig. 3. (b) Same as panel (a), but comparing suramin and NTS, demonstrating the affinity increase that is obtained due to tethering the NTS fragments
