
Fig 3. Cell survival assay.
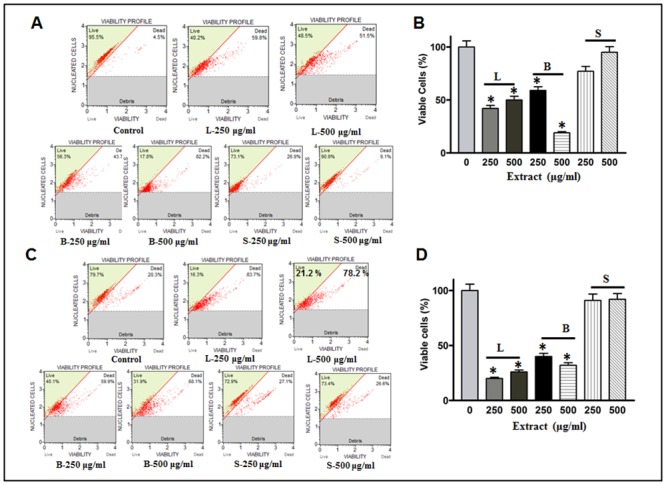
(A) MDA-MB-231 (B) HCT-8 cell lines. Cells were treated with different concentrations of plant extracts; (L) leaves; (B) bark and (S) seed. Equal numbers of cells in 20 μl were taken in 380 μl of cell counting solution. Cell viability was analyzed on Muse cell analyzer. Column (B & D) representing the quantitative analysis of the viable cells. A significant number of dead cells were observed upon extract treatment as compared with control. * Statistically significant (P≤0.05).