
Fig 4. Cell motility assays.
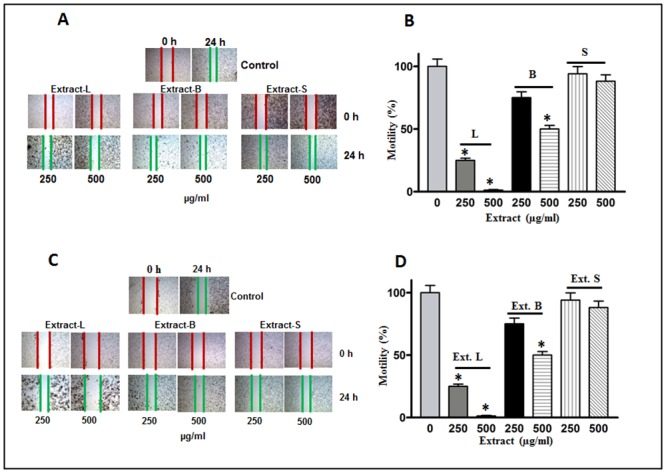
(A) MDA-MB-231 and (C) HCT-8 cell lines. Treatment patterns and annotation of the extracts were the same as descried in fig 3. A significant decrease in cell motility was observed upon extracts treatment. Columns of the bar graphs (B&D) showing 80–95% decrease in cell motility. * Statistically significant (P≤0.05).