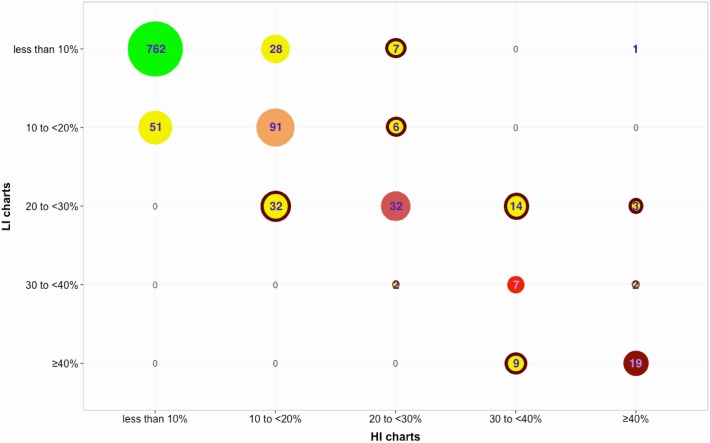
Fig 1. CVD risk prediction using the LI and HI WHO/ISH risk prediction charts on the chosen subset of APHRI data (N = 1066).
The five CVD risk ranges for whom the predicted risk using LI and HI WHO/ISH risk prediction charts concurred, are colour coded as follows: less than 10% risk in green; 10 to <20% risk in orange; 20 to <30% risk in red; 30 to <40% in light red; and ≥ 40% risk in maroon. Subjects for whom the predictions differed are highlighted in yellow circles with those that can be T HR having a red highlight.

