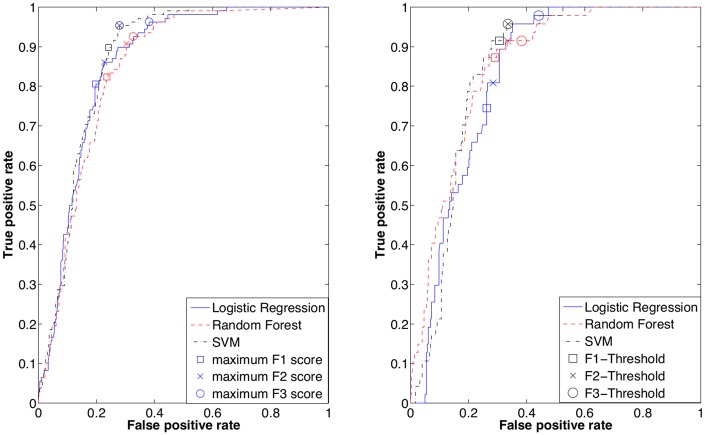
Fig 2. Receiver Operating Characteristic Curves for the SVM, RF, and RLR models.
The F1, F2, and F3 scores were computed for every point on the ROC curve from the training dataset and Plot (a) illustrates thresholds where the scores were maximum. The Out of Bag samples during training were used to obtain the ROC curve for RF since the performance on the training data was perfect (AUC 1.00). Plot (b) represents ROC of the test data where thresholds chosen from the training data are marked.

