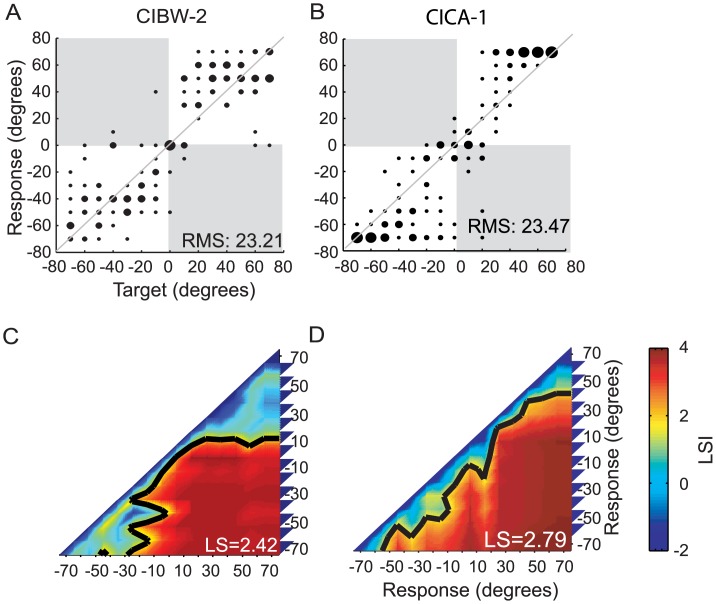
Fig 1. Two examples from the BiCIs group show different response patterns with nearly identical RMS error.
Panels A-B display scatter plots for sound source identification with the 15-loudspeaker array. The diameter of the dots is proportional to the frequency of the responses for a given target source. Data falling on the diagonal line represent perfect performance. The numbers inside each plot indicate the overall RMS error. Panels C-D display examples of spatial mapping representation from A-B. Each row and column of the matrix represents the localization sensitivity index (LSI) between one of the 15 response groups to all the 15 response groups (Responses to a given sound source target are considered as a response group). Colors denote LSI. Red shades indicate high LSI, where blue shades indicate low LSI. The matrix is symmetrical about the diagonal line with the element equal to the index between two response groups. The diagonal elements (LSI between itself) are always negative infinite. The black contours indicate threshold sensitivity (LSI = 1.65). The numbers inside each plot indicate the overall averaged localization sensitivity (LS).

