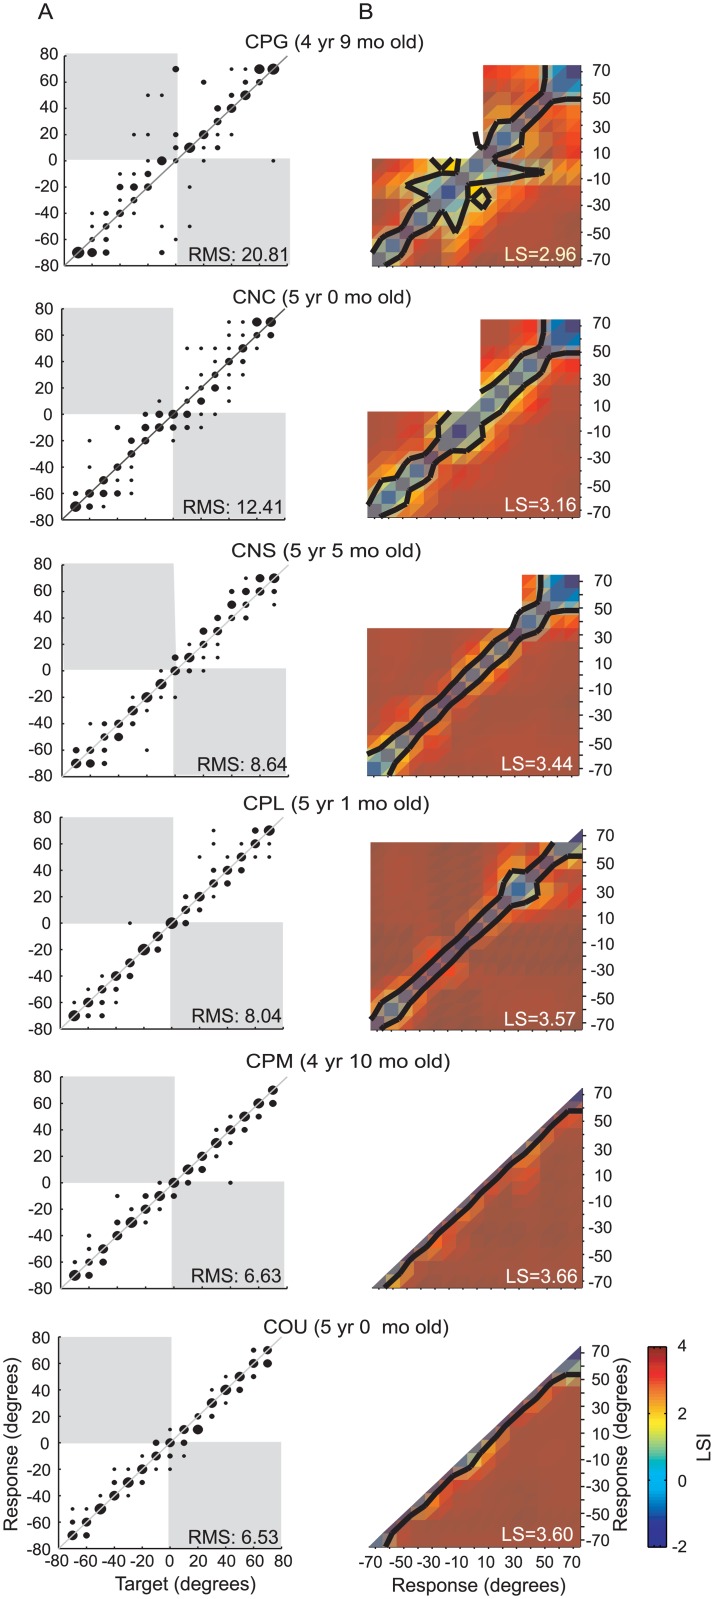
Fig 2. Results from the NH subject group.
(A) Scatter plots for sound source identification with the 15-loudspeaker array in 6 individual NH subjects. From top to bottom, subjects are ordered by the RMS errors from largest to smallest values. (B) The LSI matrix displays spatial mapping representations from individual subjects in (A).

