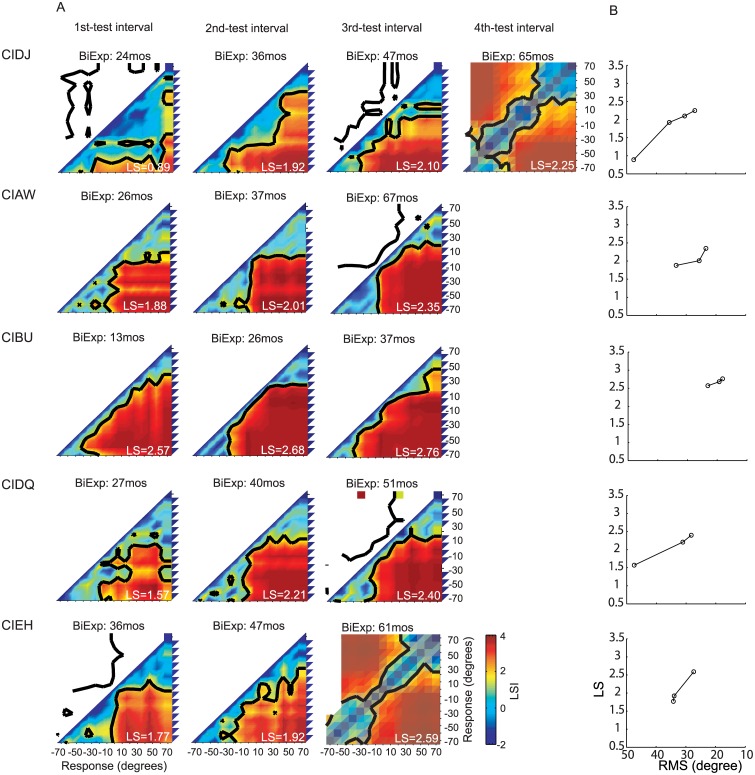
Fig 4. Individual performance in the sound source identification task for 5 children in the BiCI group with more than 2 test intervals.
(A) Each row shows the LSI matrix for spatial mapping representation for each child at each testing interval. (B) Changes in localization abilities at each testing interval for each child. Values are shown on the Y-axis for localization sensitivity and on the X-axis for RMS errors.

