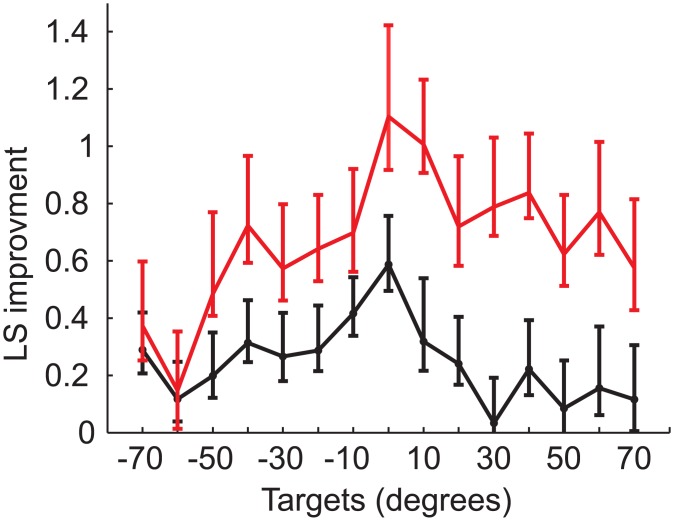
Fig 7. Improvement in localization sensitivity per target location.
Population improvement is presented as the difference in localization sensitivity between two tests. Error bars indicate bootstrap bias-corrected and accelerated confidence intervals (p<0.05). Black curve indicates the improvement over one year, and red curve includes the improvement with more than one year.

