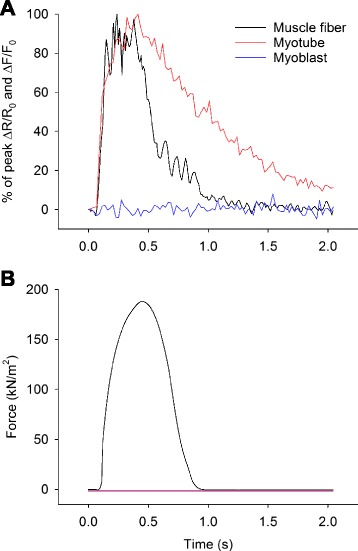
Fig. 1.

Muscle fibers and myotubes show marked differences in [Ca2+]i transient kinetics and ability to contract. a Typical example of changes in indo-1 (muscle fiber) and fluo-3 signal (myotube and myoblast) displayed as percentage of maximum in response to a single 70 Hz, 350 ms train of current pulses for a human muscle fiber (black), myotube (red), and myoblast (blue, myoblast response shown as percentage of maximal myotube response). b Typical example of force production following a single 70 Hz, 350 ms train of current pulses in a human intercostal muscle fiber (black). A flat line representing myotube (red) and myoblast (blue) force production was added for illustrative purposes as none of these cells contracted in response to electrical stimulation
