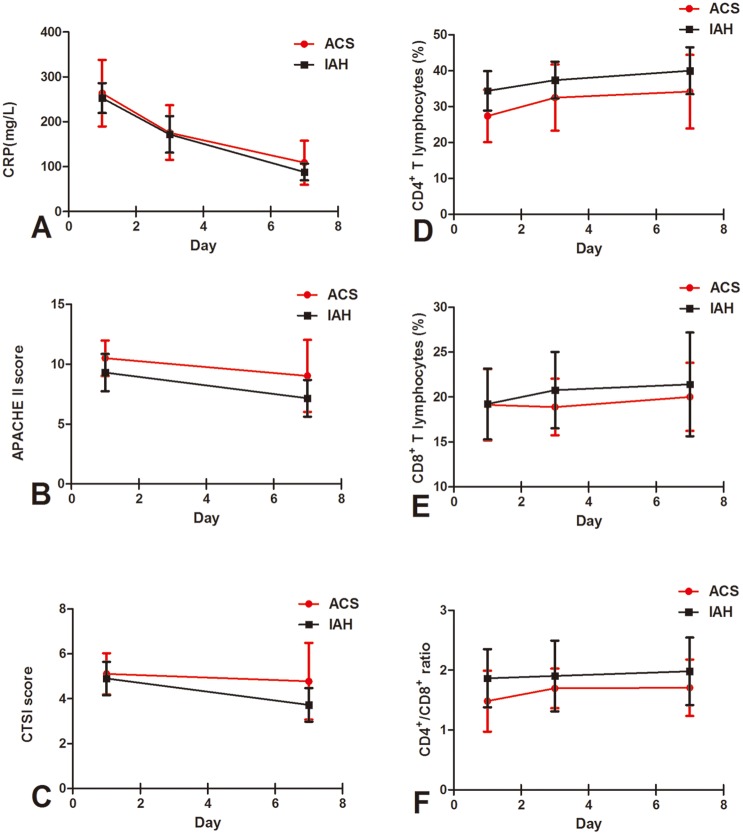
Fig 1. Sequential changes in the CRP value (A), APACHE II score (B), CTSI score (C), the proportion of CD4+ T lymphocytes (D), the proportion of CD8+ T lymphocytes (E) and CD4+ / CD8+ ratio (F) in the ACS and IAH groups.
Data of CD4+ and CD8+ T cells were available in 25, 24 and 25 ACS patients on days 1, 3 and 7, respectively.

